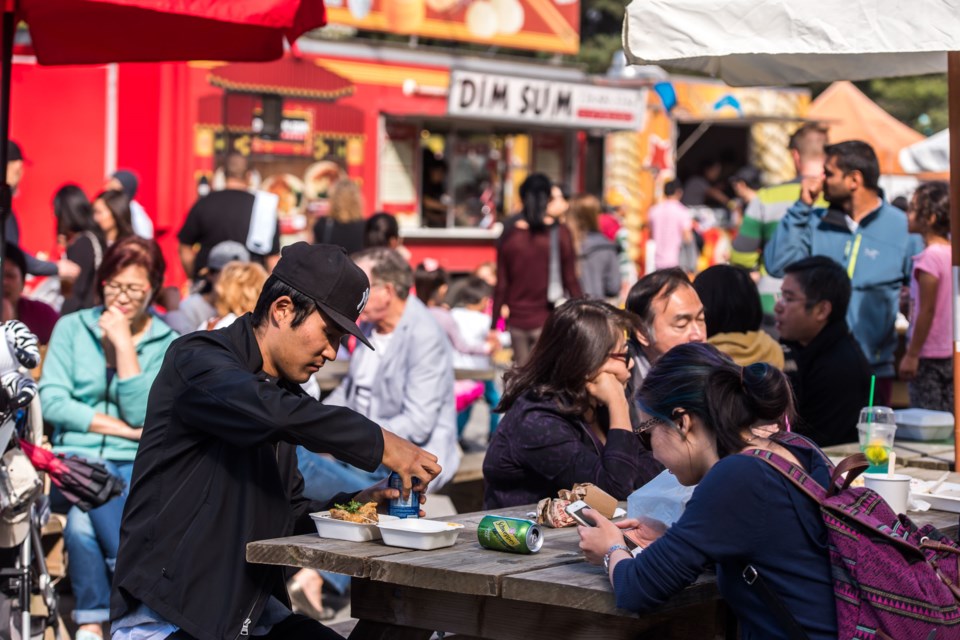
2016 marks the first time in 25 years that Richmond has recorded a visible majority of people in Richmond along ethnic lines.
Ethnic Chinese people now account for 52.5 per cent of the city’s population, according to the 2016 census.
Over the past 10 years, since the previous long-form census of 2006, the ethnic Chinese population has risen significantly, from 75,725 to 104,185. In 2011, the National Household Survey indicated Chinese people accounted for 47 per cent of the population. No visible group has been a majority since 1991, when Caucasians accounted for about 66 per cent of the population.
Despite population growth, the number of non-visible minorities (including Aboriginals and Caucasians) has declined significantly from 60,610 in 2006 to 46,645 in 2016 (now representing 23.5 per cent). Since 2011, there’s been a net departure of 9,340 non-visible minorities (largely Caucasians), while there’s been a net gain of 15,140 Chinese people.
Meanwhile South Asians grew in numbers slightly, from 13,860 to 14,360, however they represent a smaller fraction of the population today than 10 years ago.
Nearly three quarters (74.1 per cent) of Richmondites identify with having some sort of Asian origin.
“We’re one of the most diverse regions in Canada and maybe the world,” said Craig Jones, a professor of geography at University of B.C. who studies immigration patterns and housing.
He noted even with the large Asian and Chinese population there is “incredible diversity” within it.
“We’re still working through what diversity means to different people.
“Just because a majority of people identify as one ethnicity, it doesn’t mean they’re one monolithic group,” said Jones.
In 2006, visible minorities accounted for 65 per cent of Richmond’s population, whereas they now account for 76.5 per cent of the population. By comparison, Metro Vancouver’s visible minority population, including Richmond, represents 48.9 per cent of the population.
The Aboriginal population in Richmond has grown from 1,275 to 1,600 since 2006. There are 660 people with treaty status.
The new census data also shows a continued trend toward international migration.
Since 2006, non-permanent residents have risen from 1.3 per cent to 3.3 per cent of the population.
Over 10 years, the number of non-immigrants living in Richmond has remained nearly the same (71,650 in 2006 and 71,855 in 2016) thus immigrants and non-permanent residents have accounted for nearly all of the city’s population growth (23,095).
In Richmond there are 34,210 residents who are not Canadian citizens, accounting for 17.4 per cent of the population. In 2006, non-Canadians accounted for 13.7 per cent of the population. Close to half (46.7 per cent) of Richmond’s population growth comes from non-Canadians.
There are 15,245 “recent immigrants” in Richmond, meaning they arrived since 2011. Of those, 14,165 came from Asia, 425 came from the Americas, 415 came from Europe and 175 came from Africa. From Asia, 8,940 came from mainland China, the largest cohort, ahead of those from the Philippines (2,135).
Of the 102,335 immigrant households who landed since 1980, 71,885 are economic immigrants, while 3,465 are refugees.
Jones said high housing costs and a lack of pre-1980 purpose-built rental stock in Richmond results in refugees accounting for 3.3 per cent of the city’s immigrant population, whereas in Metro Vancouver it’s nine per cent.


